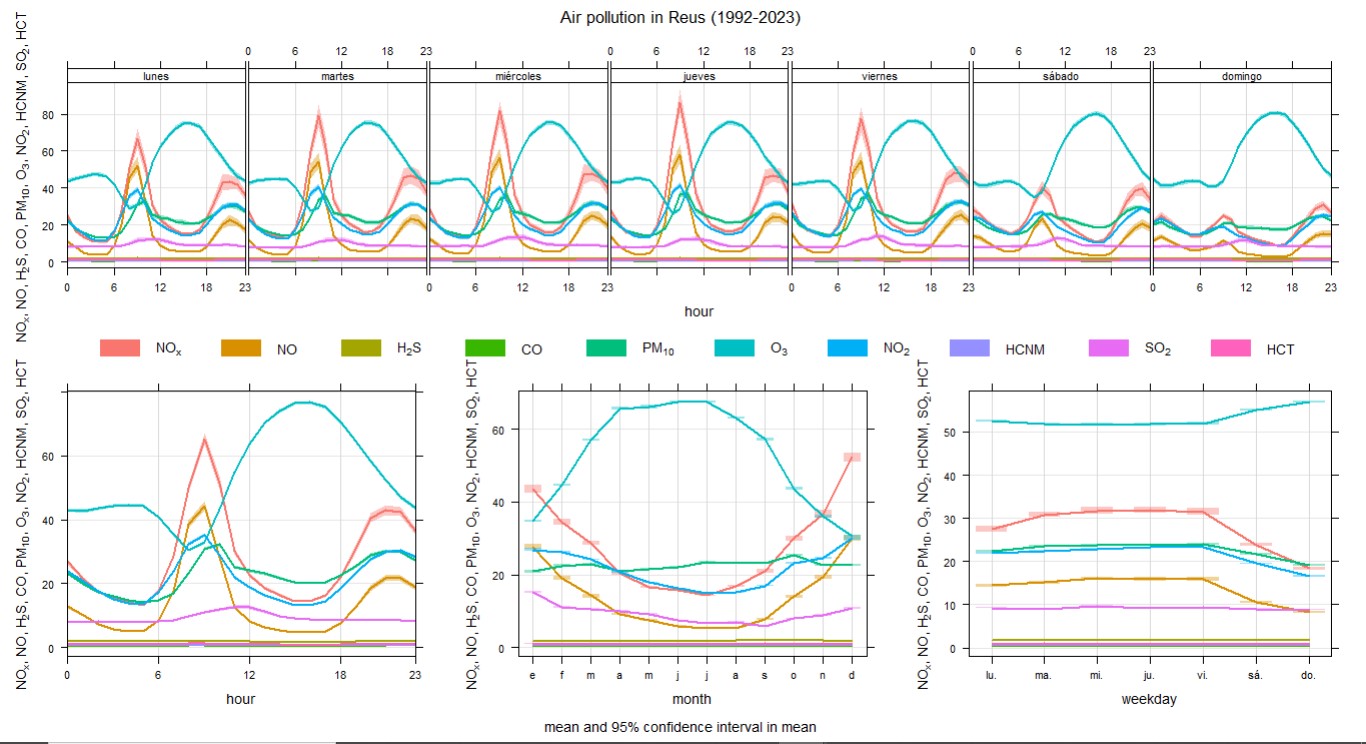
Here's a time variation of the air pollution in Reus since 1992 to 2023 i different graphics
NOX data collection starts around August/September 2011, resulting in lack of data from previous years, according to the graph we can see that it reaches a maximum of 20µg/m3 and minimums of less than 50µg/m3, at the end of 2015 and 2016 there were peaks at 9:00 and 21:00, since then there are no peaks exceeding 100/150µg/m3.
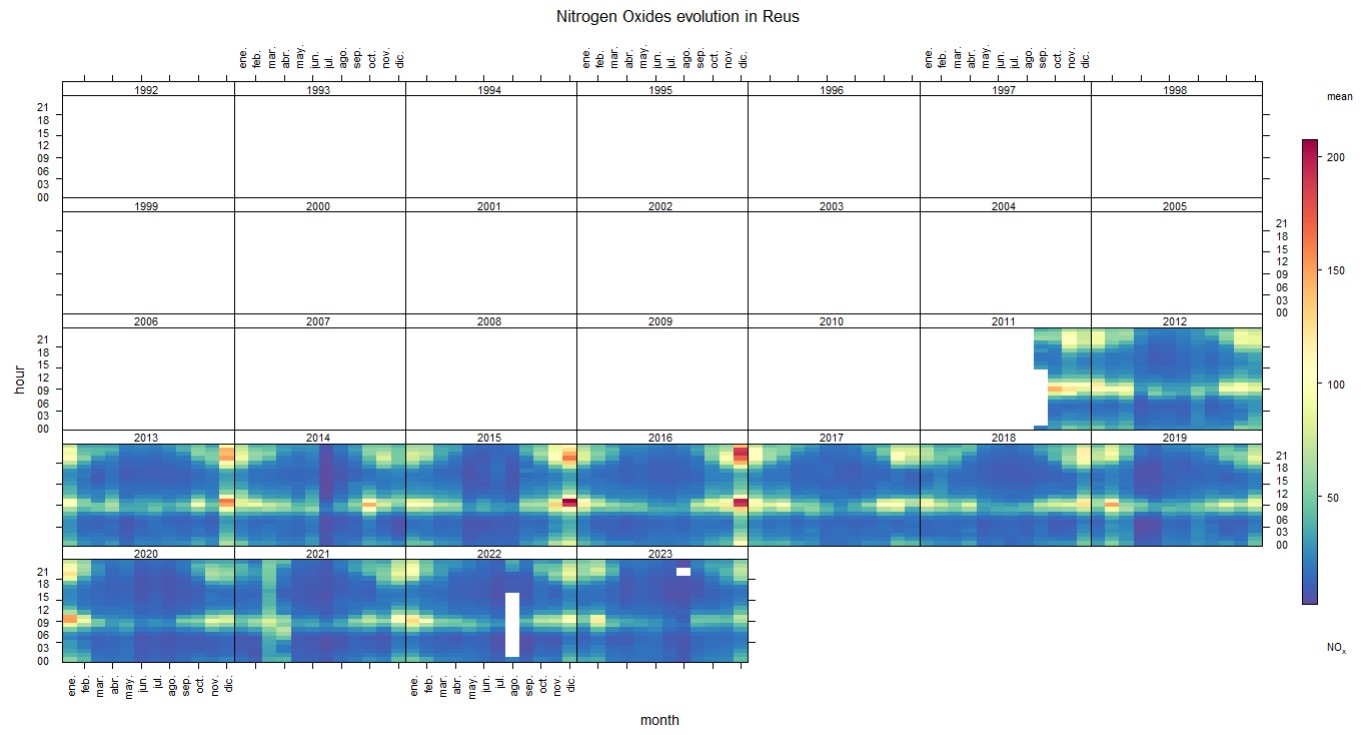
According to the NO graphic the amount of nitric oxide has dropped from 300µg/m3 to >50µg/m3, in 7 years, at the beginning of 1992/end of 1993 there was the highest peak of NO in Reus, these peaks occur at 21 PM and 9 AM, of that same year also missing data for part of August, all of September and all of October, also missing data for September 1995.

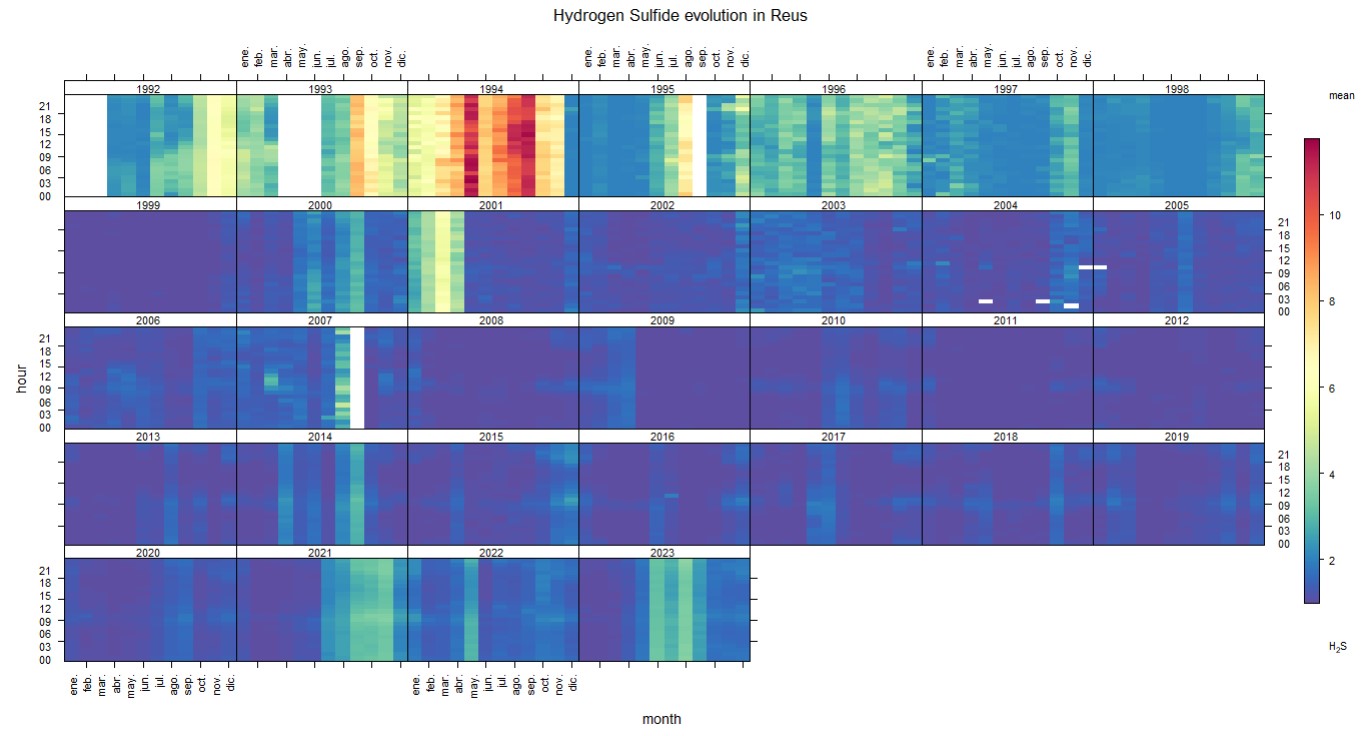
In this graphic we can see how the amounts of H2S are mostly divided in months from 1992 to 1996, in these years we can see the highest peak in 1994 with more than 10µg/m3 , in fact they are in the months of March, August and September with the highest amount of pollution, after 1996 it goes down to levels below 4 µg/m3 until 2001 with another peak but not as big as the previous ones, around 5-6µg/m3 in the first four months.
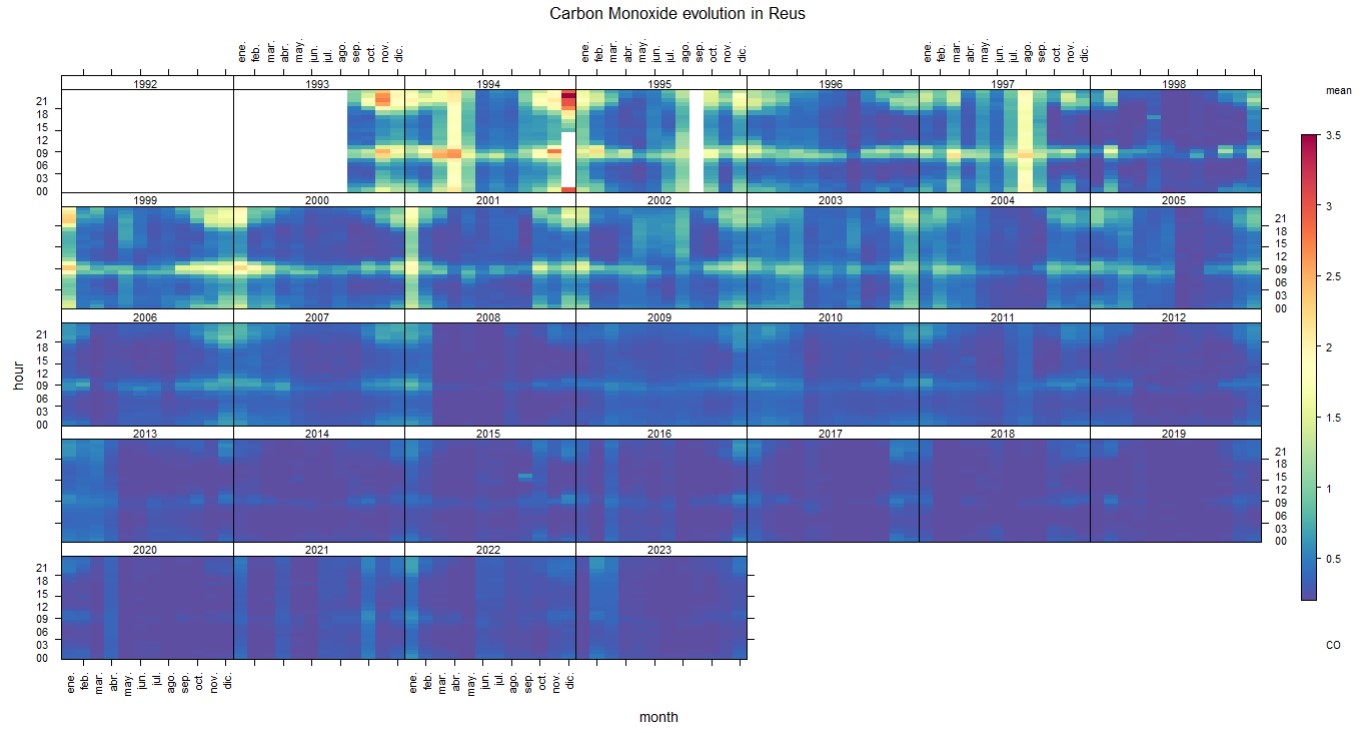
The CO graphic begins in September 1993, we can see how the following year has its highest peak in December with numbers slightly higher than 3 µg/m3 , according to the limits set by EU and WHO the CO limit is 10 µg/m3 , resulting in not passing these limits, also in this same month are missing data from the morning hours, you can also see how the levels change in various ways from this year until 2003, the year in which their levels are below 1
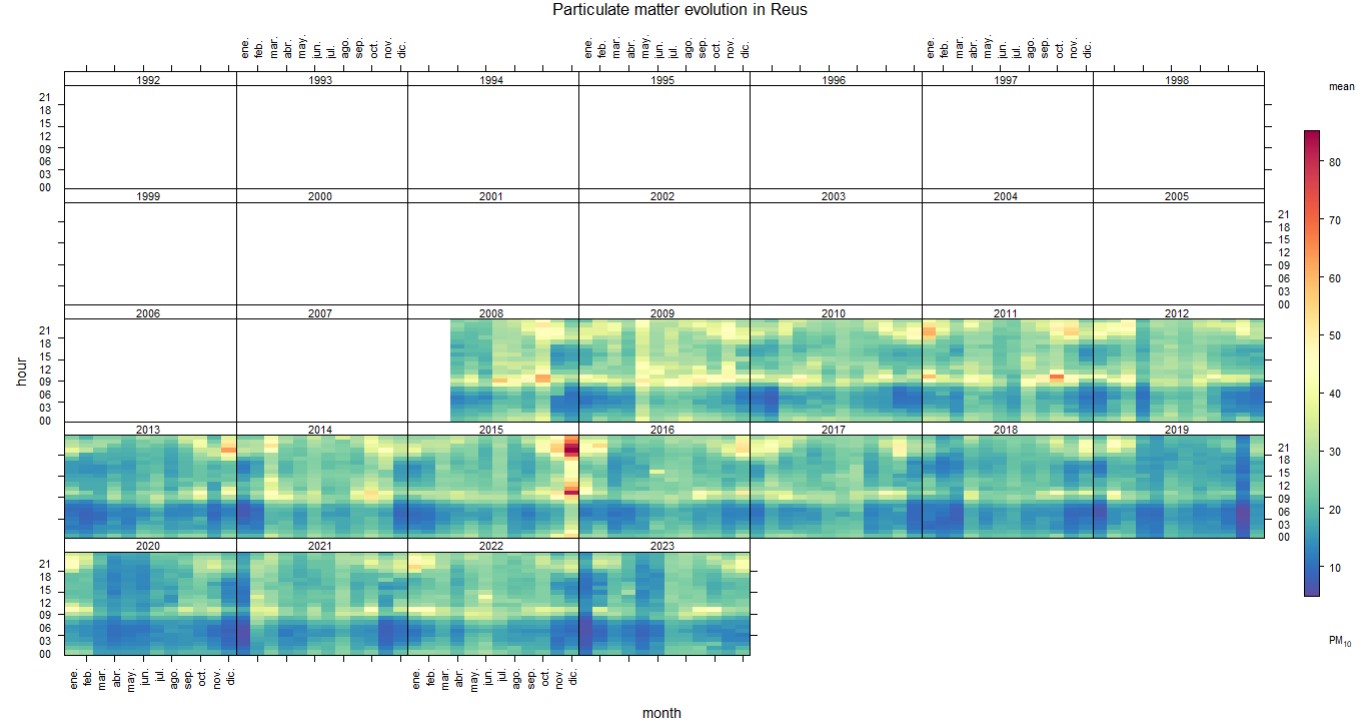
In this graphic of PM10 we can see that their data starts from May 2008 without access to previous years, apart from this we can see how the levels vary in all years between 10 and 50 µg/m3 , except for December 2015 where there is a peak of more than 80 µg/m3 at 12 PM and AM, with this we can see that it has exceeded the limit set by EU of a maximum of 50 µg/m3 for each day.
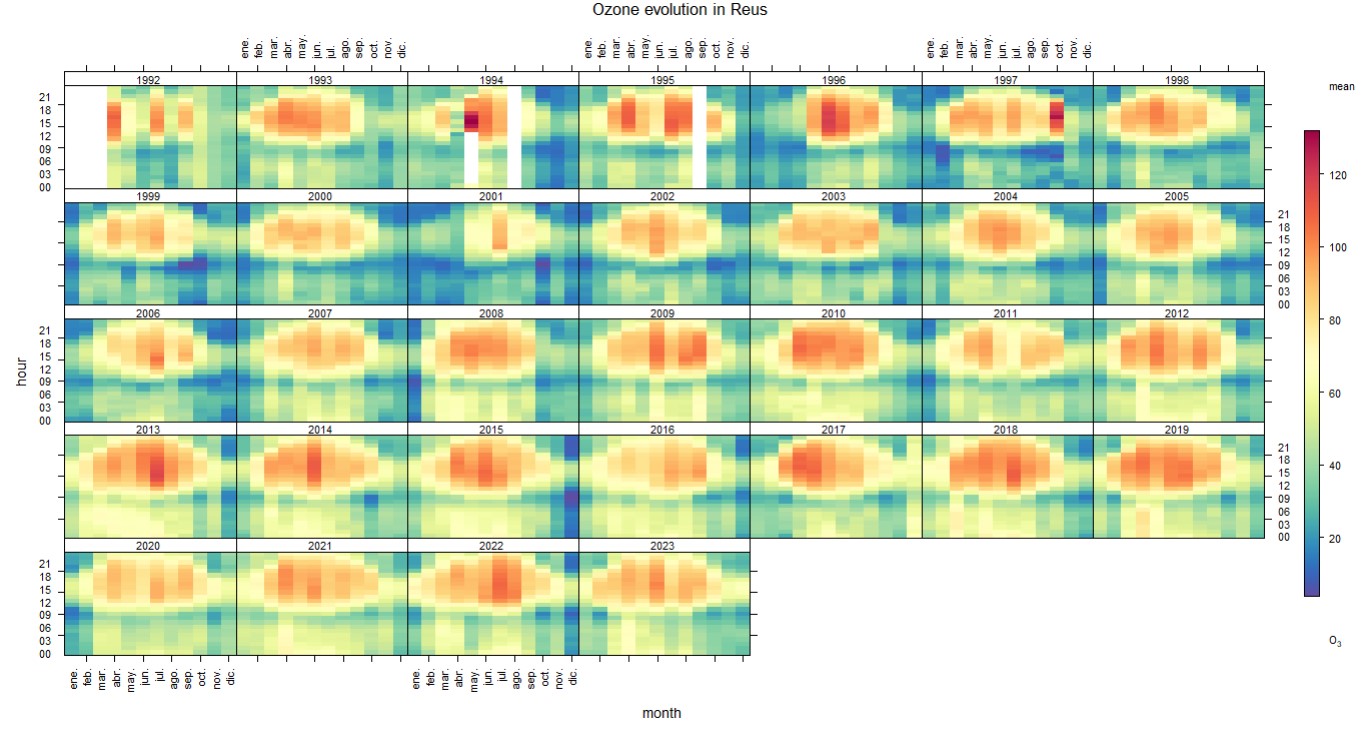
According to the O3 graphic you can see how a pattern is formed over the years in which its highest levels are around 10 µg/m3 in the afternoon hours in non-winter months throughout the years, even so in 1994 and 1997 there are two peaks that reach the EU limit of 120 µg/m3 but since then they have not touched the limit again.
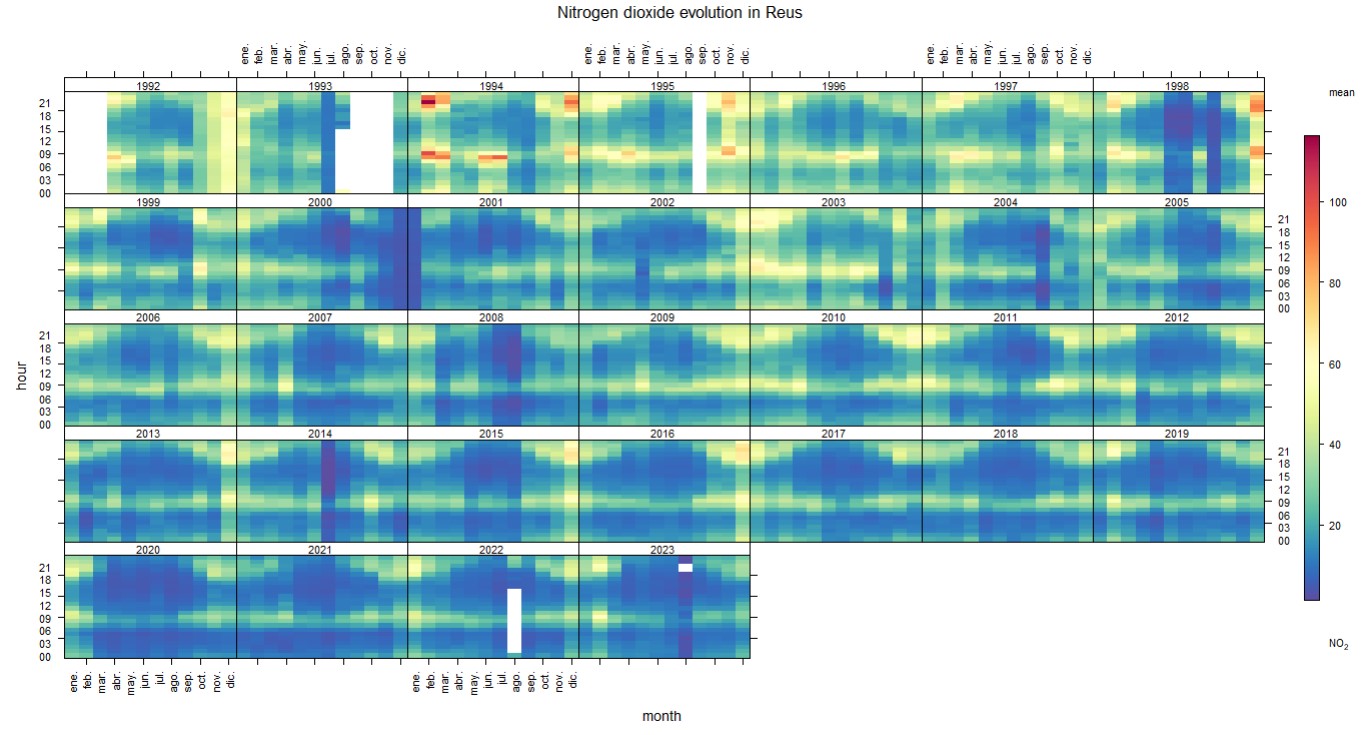
In the NO2 graphic you can see that in the winter months the level of pollution increases, normally in the 12 AM and PM with levels around 40 or 60 µg/m3 per day, in the rest of the days is around 30, in 1994 there are several peaks that exceed 90 µg/m3, also it should be noted that the maximum level set by WHO is 25 so repeatedly exceed this limit.
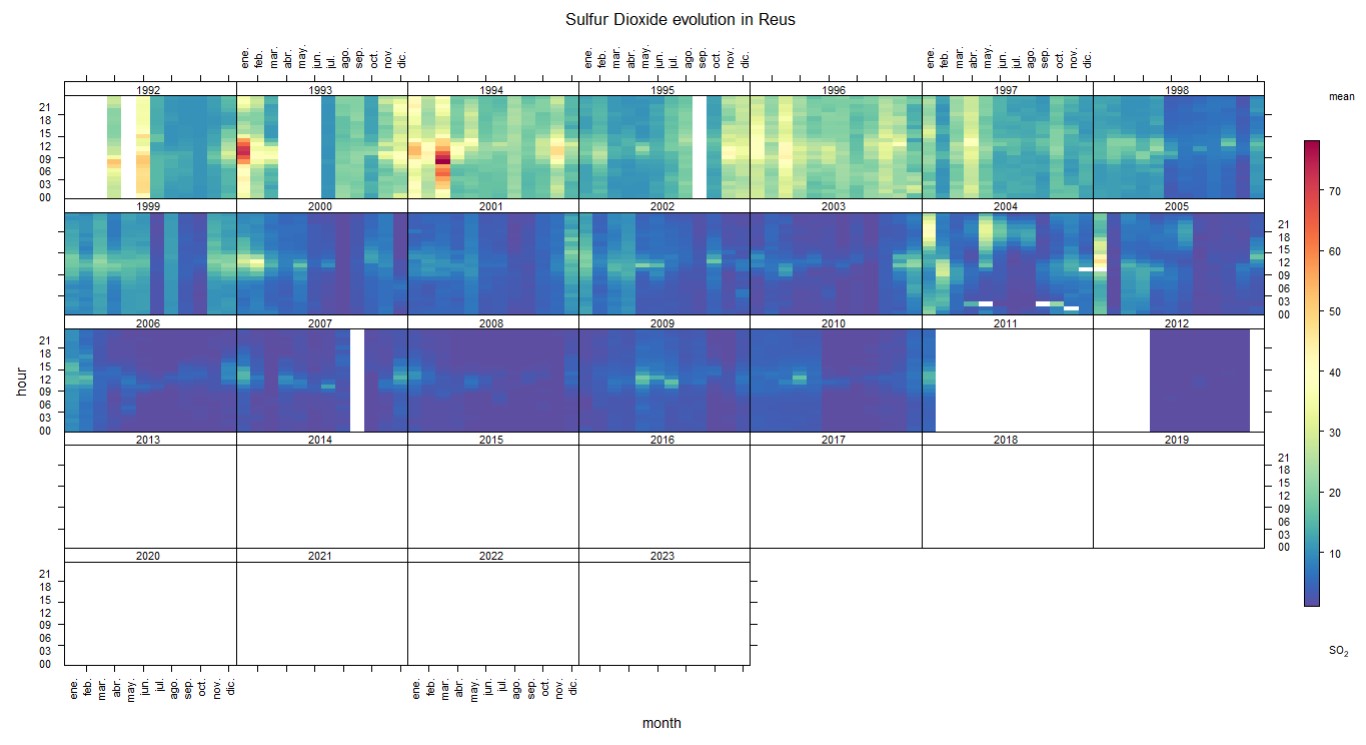
In the SO2 graphic, although it begins in 1992, the data ends in 2012 without access to later years, you can also see that from 1992 to 1997 has had 3 cuts of data, one in 1992, another in 1993 and 1995, between these years there is a regular amount of pollution with maximums of 50 µg/m3 apart from this, in the first months of 1993 and 1994 there are peaks of more than 60 µg/m3 , after these years the levels are lowered regularly until they are less than 20 µg/m3, until 2011 in which almost all the year and part of 2012 there are no data but there are no rising rates.
The data of the HCT graphic is cut from 2001 without access to later years, you can see how in most months the pollution levels are lower than 2 µg/m3 , but in 1992 there is a drastic rise until the end of 1993 in which at the beginning of this same year reaches its peak of more than 6 µg/m3.
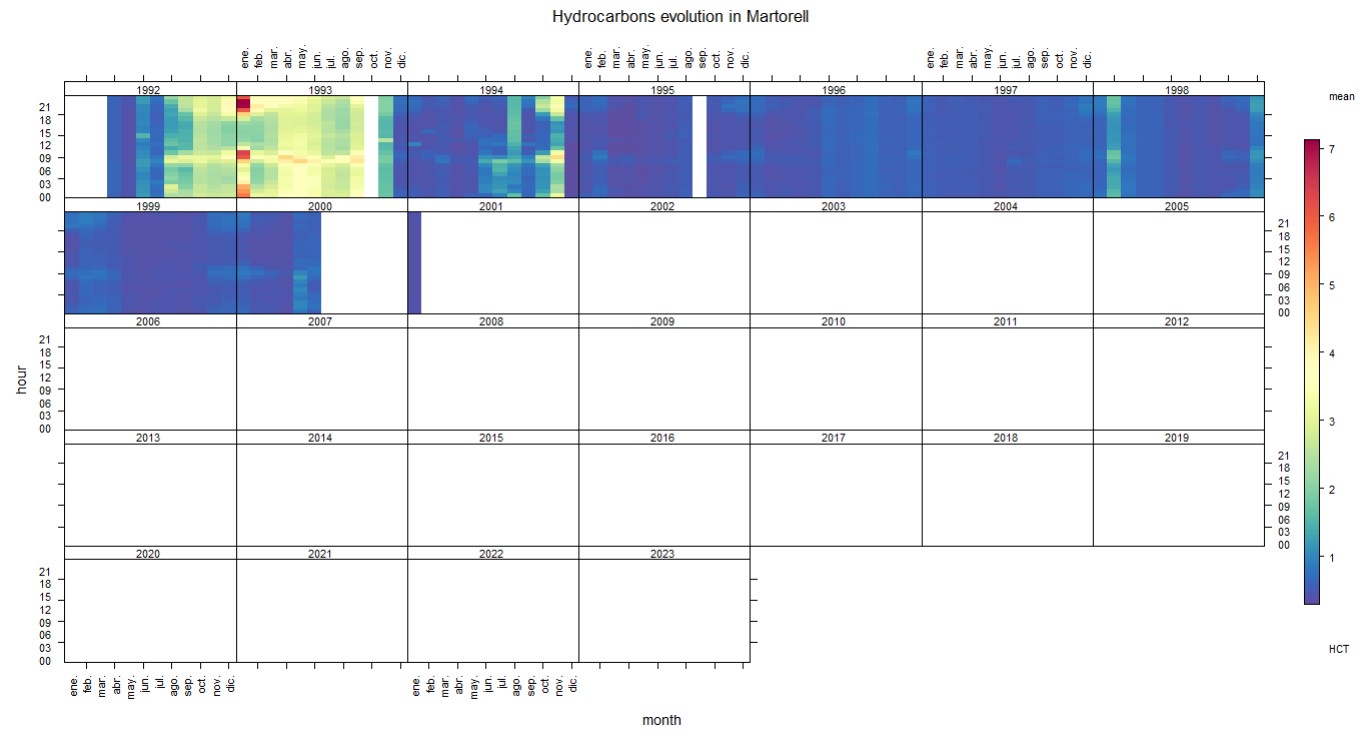
The HCNM graph is very similar in content to that of HCT, both end their data in 2001 and peak in January 1993 and maintain a regular level since 1994 below 2 µg/m3.
